Basic Spark Application
Before starting any of these examples, please ensure that your Spark configuration is ready. You may refer to the Spark setup guide.
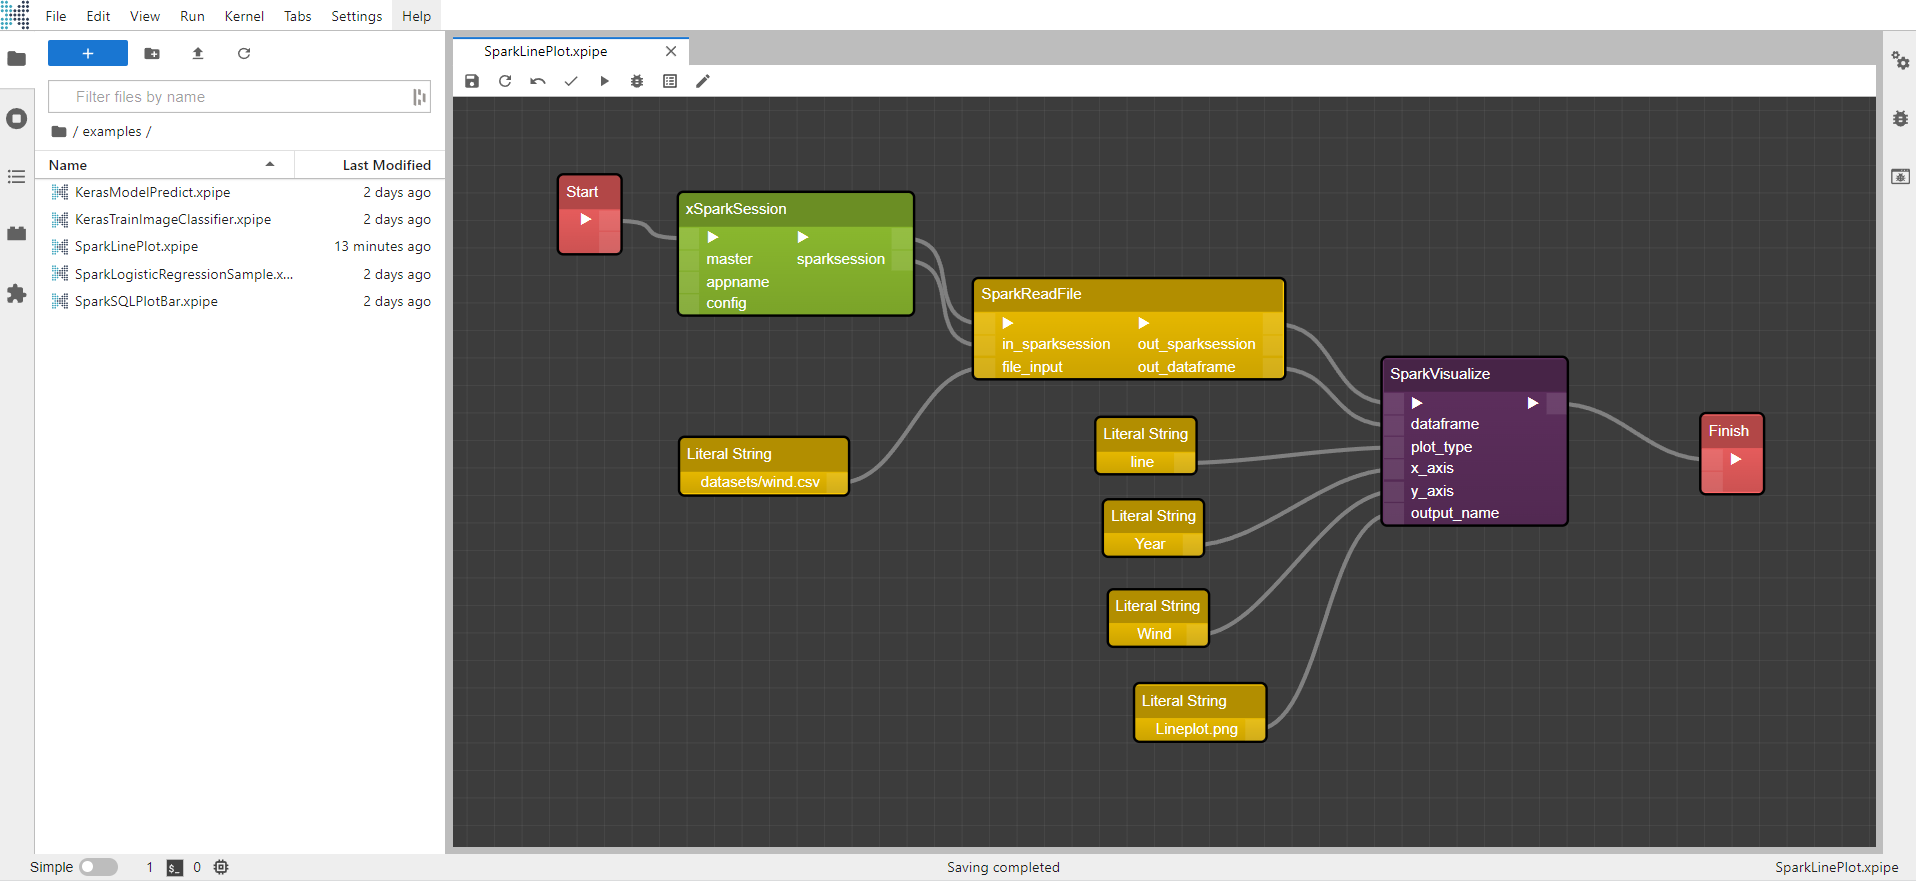
Example: SparkLinePlot.xircuits
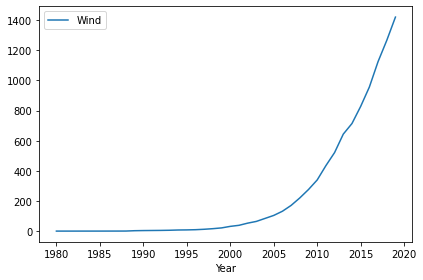
In this example, you will learn how to start a basic spark application that reads a time series dataset and plots the data.
-
To start a Spark workflow, you will need to start with a
xSparkSession. All components that require a session can be connected to the session parameter port. -
To read a file, the xSparkSession is connected to
SparkReadFile. In this example, theLiteralStringpath to the time series data,wind.csv. is supplied to the file_input InPort.SparkReadFilesupports csv, parquet, orc, and json data files.
You may need to upload the file to the HDFS if you're running Spark in a cluster.
-
SparkReadFilewill output a Spark dataframe which can be then passed to theSparkVisualizecomponent.SparkVisualizeutilizes matplotlib library to plot. You also would need to specify which of the data column to be the X and Y axis. -
Run using the Xircuits Runner or through your local terminal! It will generate the following output.
Executing: xSparkSession
Executing: SparkReadFile
+------+-----------+
|  Year|       Wind|
+------+-----------+
|1980.0|        0.0|
|1981.0|        0.0|
|1982.0|        0.0|
|1983.0|0.029667962|
|1984.0|0.050490252|
|1985.0|0.072761883|
|1986.0| 0.14918872|
|1987.0|0.205541414|
|1988.0|0.342871014|
|1989.0|   2.597943|
|1990.0|     3.5356|
|1991.0|   4.096951|
|1992.0|   4.611373|
|1993.0|    5.55795|
|1994.0|   7.284414|
|1995.0|   7.935523|
|1996.0|   9.288649|
|1997.0|  12.134585|
|1998.0|  16.108642|
|1999.0|   21.24186|
+------+-----------+

Executing: SparkVisualize